Teaching-Data-Visualisation
Presentation and exercises for the Software Sustainability Institute Research Data Visualisation Workshop (RDVW)
README.md - 2016-07-28_manchester_datavis
This repository contains files for the Python hands-on session of the Software Sustainability Institute Research Data Visualisation Workshop (RDVW) at the University of Manchester, 28th July 2016.
- Course website: http://software.ac.uk/rdvw
- Course registration: Eventbrite
- Workshop report: SSI blog post
- Videos of workshop keynotes: YouTube
- Speaker slides: Google Drive
- Storify of tweets: Storify
Running this workshop in your browser
These workshop materials are designed to be compatible with MyBinder. To start an instance of this repository, click on the badge below:
![]()
Acknowledgements
These exercises borrow heavily and adapt or use material from several excellent sources, including:
- Data Carpentry: http://www.datacarpentry.org/
- Software Carpentry: http://software-carpentry.org/ - especially the R novice Gapfinder material
ggplot2: Elegant Graphics for Data Analysis: http://www.springer.com/us/book/9780387981413bokehdocumentation: http://bokeh.pydata.org/en/latest/docs/gallery.html#gallery- “39 studies about human data perception in 30 minues”, Kennedy Elliott: link
- The Data Visualisation Catalogue: http://www.datavizcatalogue.com
If you recognise some of this content and are not acknowledged here, please let me know and I will correct that! I don’t think I’m in breach of any copyright or licensing, but if you notice any such breaches please let me know and I will rectify as soon as is possible.
Exercises
One-variable, continuous data
Learning Outcomes
- Generating randomly-distributed example data
- Representing one-dimensional continuous-valued data with histograms, KDE plots, and rug plots
- Using
matplotlibandseabornlibraries - Presenting arrays of images
- Use of
figure()andsubplots()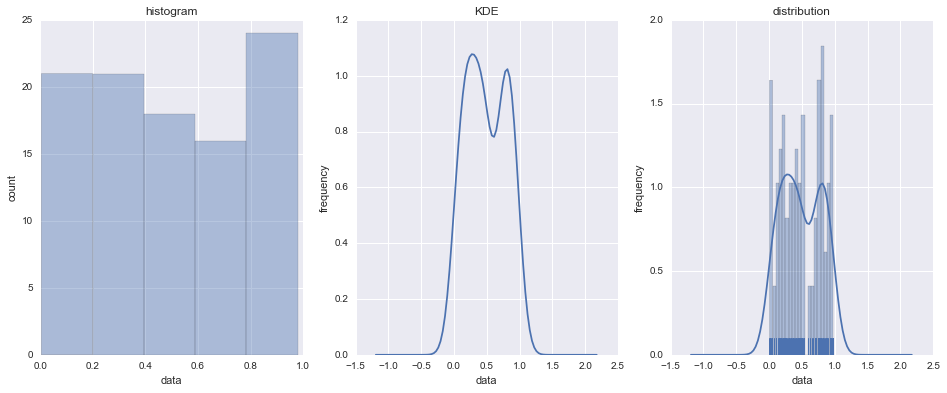
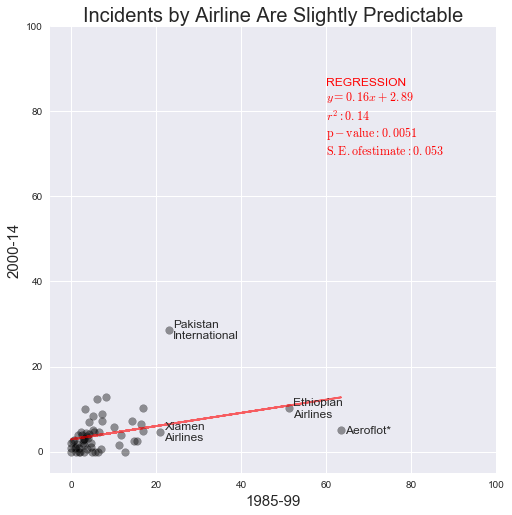
Two-variable, continuous x, y data
Learning Outcomes
- Representing two-dimensional continuous x and y data using
matplotlibandseabornlibraries - Use of
figure()and subplots - Annotating plots with text
- Working with long and wide form
DataFrames inpandas - Using statistical overlays and
seaborn’s statistical plots
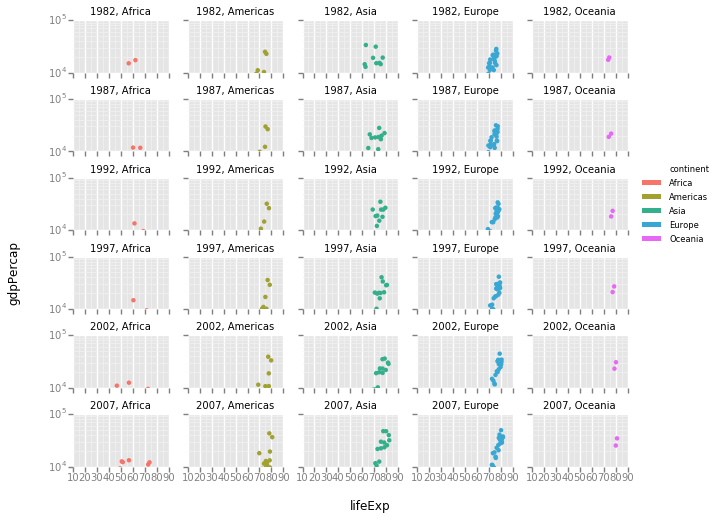
Grammar of Graphics
Learning Outcomes
- Understand the Grammar of Graphics
- Use the Grammar of Graphics with the
ggplotmodule to produce plots from aesthetics and geometric representations. - Use layers to produce new visualisations specifically to suit your data, showing data and statistical summaries
- Use multi-panel figures to display complex datasets
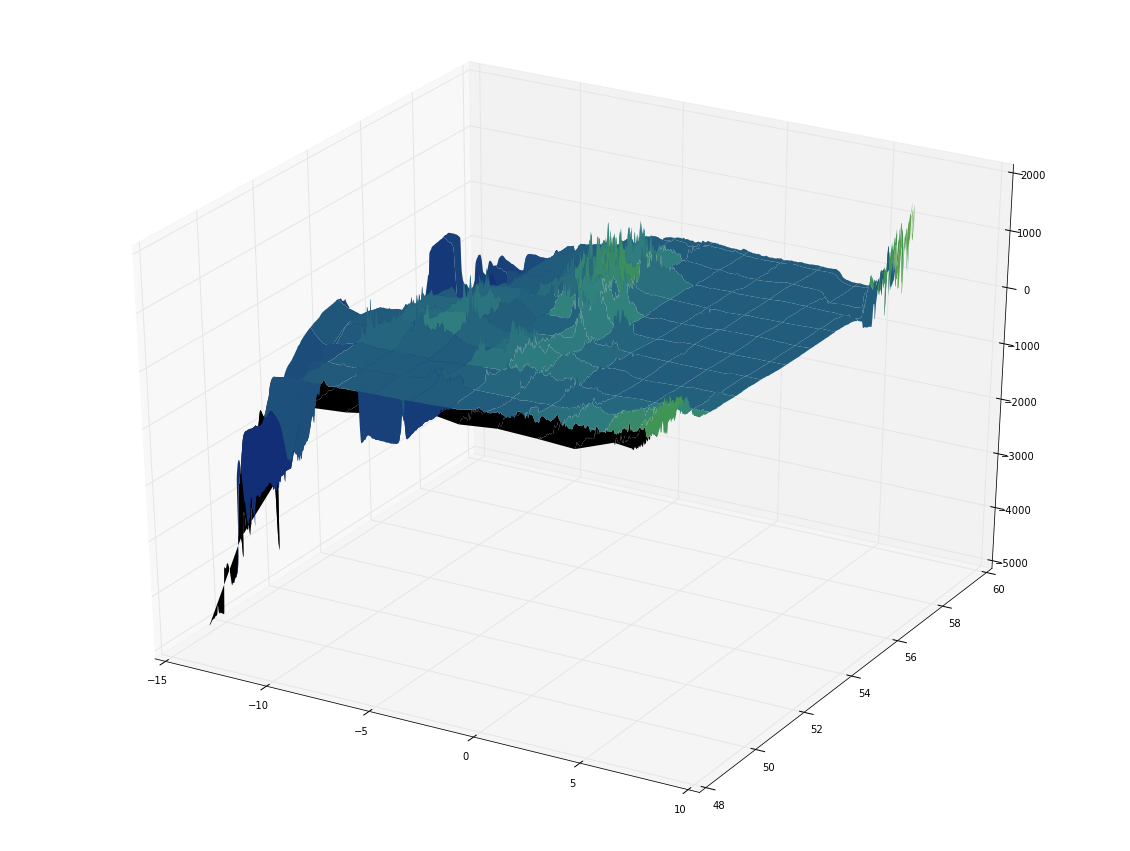
Imaging 2D arrays, colormaps, and 3D surface plots
Learning Outcomes
- Read and use NetCDF format data using Python
- Visualise array data as a heatmap/image
- Explore array data visualisation with a range of colour palettes, and understand how selection and normalisation of colour palettes can influence the interpretation of data
- Visualise 2D array data as a 3D surface plot
- Explore the application and influence of colour palettes and lighting effects on the interpretation of 3D surface plots
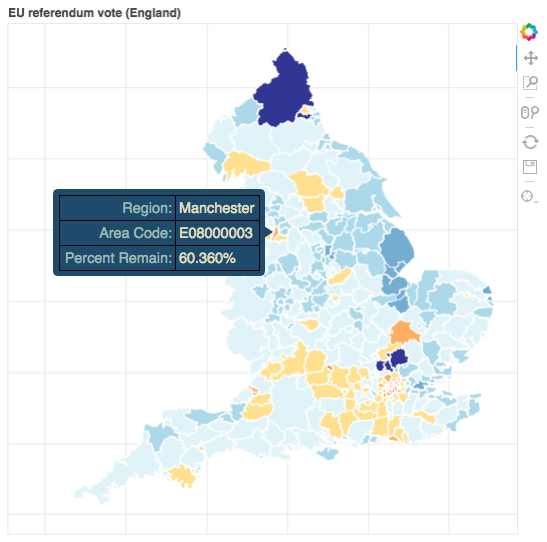
Interactive map with bokeh
Learning Outcomes
- Import and process shapefile GIS data using
pyshp - Import public
.csv(electoral) data usingpandas - Render GIS boundary data in an interactive
bokehplot - Colour geospatial data by results in an interactive
bokehplot
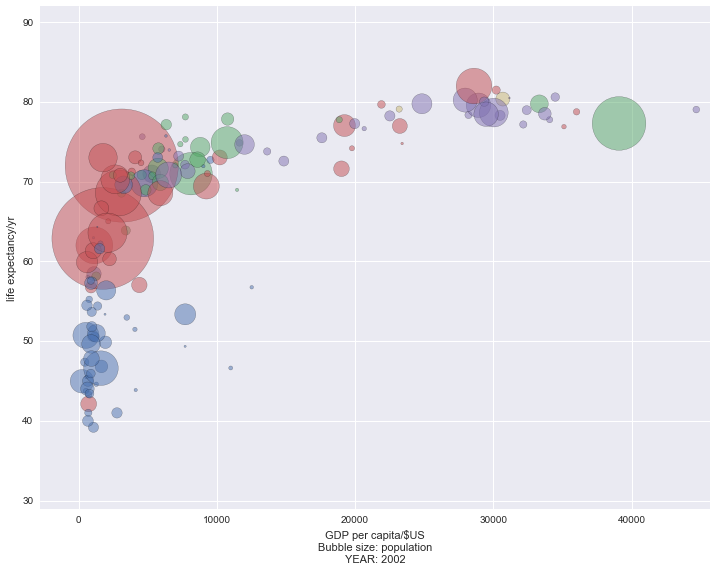
Making movies with matplotlib and seaborn
Learning Outcomes
- Understand
matplotlib’sanimationfunctionality - Generate animations using
FuncAnimation - Generate line graph and bubble plot animations